In the upcoming pages, we’ll cover linear equations, and look more closely at slope. We’ll also review how to graph linear equations and see how those graphs compare with graphical representations of linear inequalities.
A linear equation is another name for a linear-function rule. In standard form, using more of algebra’s typical alphabet-soup style, a linear equation looks like this:
y = mx + b
Let’s go through what the m and the b represent. The x and y variables will still be the input and output values, respectively, allowing you to create ordered pairs to plot on a coordinate plane.
The variable b represents the y-intercept of the graph of the line. The y-intercept is the place where the line crosses the y-axis.
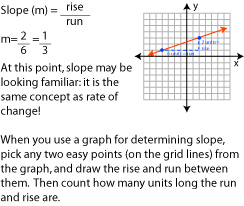
The variable m represents the slope of the line. Slope is the steepness of the line; the steeper the line, the greater the slope.
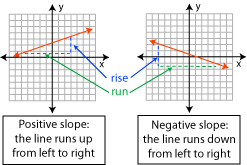
Slope is either positive or negative. Slope is calculated as the amount of rise (change in height) per amount of run (horizontal change). Slope can be determined with a formula or from a graph of a line. First, we will look at how to determine the slope just by counting units from the graph of a line.
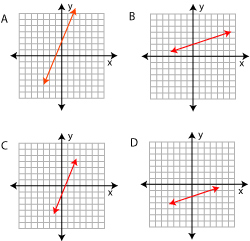
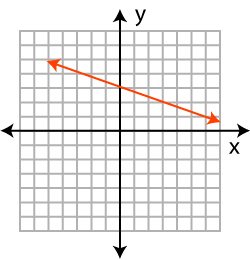
What is the slope of the line below?
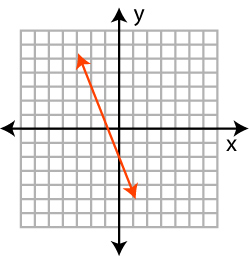


The correct answer is D. The slope of the line is negative, so that rules out choices A and C. The rise of the line is (-5) and the run is 2. Slope is generally left as an improper fraction, rather than as a mixed number.
Slope can also be calculated if you know any two points on the line. You can find the points yourself from a graph or you may be given the points without any graphical representation of the line. The formula follows:

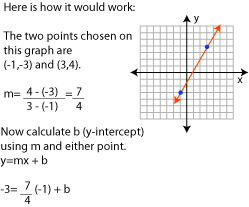
What is the slope of the line that passes through the points (4, -7) and (-2, 5)?
What is the slope of the line that passes through the points (-3, -2) and (6, 8)?


The correct answer is B. Using the formula for slope, you should have:
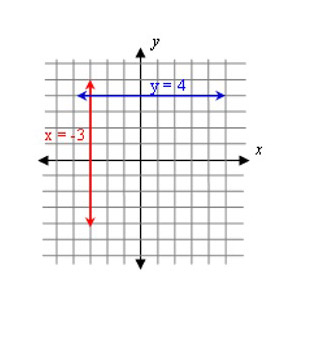
Horizontal lines have a slope of zero (m = 0). Since this makes the “mx” term of the linear equation disappear, all horizontal lines are an equation of the form y = b.
Vertical lines have an undefined slope. The “run” on a vertical line would be zero, and when you divide by zero, you get an undefined answer. Vertical lines are equations in the form of x = n, where n is the x-intercept of the graph.
Parallel lines have the same slope. Think about what parallel lines look like: they are always the same distance apart, so they must have the same amount of steepness.
y = 3x + 7 and y = 3x + 12 are parallel.
The slopes of perpendicular lines are related, but it is a little more complicated. The slopes of perpendicular lines are negative reciprocals of each other. If a line has a slope of  , then the line perpendicular to it has a slope of
  .
.
 are perpendicular.
Graphing a line from an equation is a quick task. You can graph a line without having to use several input values, now that you know about the y-intercept and slope in each equation.
Follow these steps to graph a line from its equation:
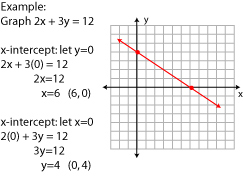
Graph 
To find the intercepts of the line, you will be replacing one variable with zero.
Steps:
Which graph below shows the line y = 3x + 2?
The correct answer is A. The y-intercept of the line is (0, 2). The slope is three, which means it has a rise of three and a run of one.
Now that you can graph lines from equations, let’s work on going the other direction: writing an equation of a line from its graph. As you can probably imagine, this can be done in several different ways; here are two basic methods.
Depending on what the line looks like on the graph, you may be able to easily determine the y-intercept and count out the slope to another obvious point. Then all you have to do is put it into the y = mx + b form.
Therefore, 
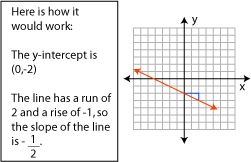
What is the equation of the line shown on the graph?


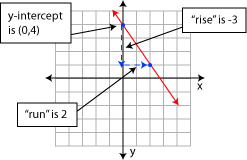
The correct answer is B. This problem can be solved just by looking at the y-intercept and counting out the slope. The run is 3, and the rise is 1, so the slope is  . Therefore the equation is
  .
.
A linear inequality looks just like a linear equation, but the equal sign is replaced by an inequality sign: <, >, ≤ ≥.
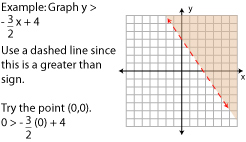
To graph a linear inequality, you would use the same method you used to graph a linear equation, except for the following: if the equation uses a less than (<) or greater than (>) sign, the line will be dashed instead of solid. If the equation uses a less than or equal (≤) or greater than or equal sign (≥), the line will still be solid.
For linear inequalities, you will shade the graph either above or below the line that you have drawn. The easiest way to determine which part to shade is to choose a point either above or below the line; (0, 0) is often an easy point to choose. Plug in the values of the point and see if the inequality is true. If it is true, shade the area that contains the point. If the inequality is false, shade the area on the other side of the line.
Take a look at the following example to see how it works.
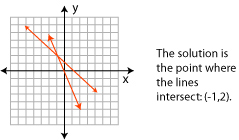
What is the solution to the system of equations shown on the graph below?
How many solutions are there to the following system of equations?
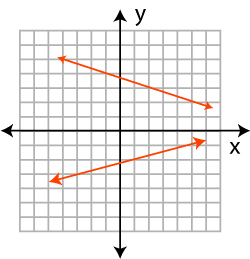
The correct answer is B. Even though the lines have not yet intersected, they continue off the part of the coordinate plane that we can see and will intersect at one point.