In this lesson we will review measurement and calculation within science.
Data is the information collected during an experiment. This information could be weight, temperature, pH, or any other scientific investigative material. Since we have this information and we conducted the experiment, we understand the data we collected. However, how do we explain this data to someone else? How do we display this data so it can be easily read and interpreted? Many scientists use graphs to showcase data. There are many types of graphs or charts that may be utilized: line, bar, pie, diagrams, and sometimes even models or maps. In order to make it possible for our audience to understand our data, a legend and key for all of these types of data displays should be included. The most commonly used charts or graphs are a line graph, bar graph, and pie chart.
Line graphs are used to summarize how two pieces of information are related and how they vary depending on one another.

Example of a line graph used correctly to show the large impact of the 1997-1998 El Niño Southern Oscillation effect on precipitation on the island of New Guinea.
Bar graphs consist of an axis and a series of labeled horizontal or vertical bars that show different values for each bar. The numbers along a side of the bar graph are called the scale.
Pie charts are used to display the sizes of parts that make up some whole. A pie chart is a circle graph divided into pieces, each displaying the size of some related piece of information.
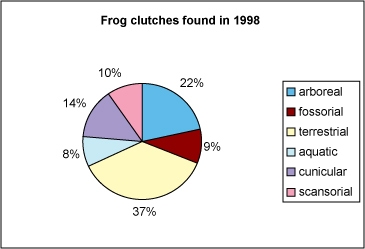
This pie chart accurately shows the different numbers of frog clutches found in 1998. Each category is a separate micro-habitat where the frogs live and lay their eggs.
Sometimes data must be depicted utilizing numbers. All numbers must be consistent. To accomplish this task, scientists use scientific notation.
Sometimes data must be depicted utilizing numbers. All numbers must be consistent. To accomplish this task, scientists use scientific notation. Scientists often deal with very small and very large numbers. These numbers are written as powers of 10. Scientific notation takes the form of M multiplication symbol 10n where 1 ≤ M < 10 and n represents the number of decimal places to be moved. Positive n indicates the standard form is a large number. Negative n indicates a number between zero and one.
Example 1:
To convert 4,500,000 to scientific notation, move the decimal point so that there is only one digit to its left, a total of 6 places.
4,500,000 = 4.5 ∗ 106
Example 2:
To convert 0.000018 to scientific notation, move the decimal point 5 places to the right.
0.000018 = 1.8 ∗ 10−5
Express the following in scientific notation. 0.001 = _____
Express the following in standard form. 1.1 ∗ 103 = _____
A measurement can only be as accurate and precise as the instrument utilized. A scientist must be able to express the accuracy of a number, not just its numerical value. We can determine the accuracy of a number by the number of significant figures it contains.
There are five rules governing significant figures:
| Rule | Example |
|---|---|
| 1. All digits 1-9 inclusive are significant. | 12 has 2 significant figures. |
| 2. Zeros between significant digits are always significant. | 104 has 3 significant figures. |
| 3. Trailing zeros in a number are significant ONLY if the number contains a decimal point. | 10 has 1 significant figure. |
| 4. Zeros in the beginning of a number whose only function is to place the decimal point are not significant. | 0.065 has 2 significant figures. |
| 5. Zeros following a decimal fraction’s rightmost significant figure are significant. | 0.000123 has 3 significant figures. |
How many significant figures are in each number below?
a) 500. _____
b) 0.01 _____
c) .005 _____
a) 500. has 3 significant figures
b) 0.01 has 1 significant figure
c) .005 has 1 significant figure
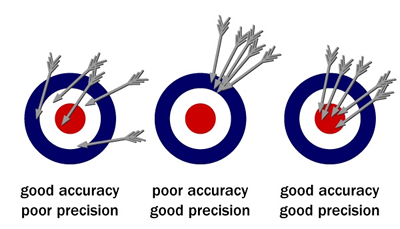
Scientists use numbers quite often during investigations. Math and science are very interrelated subjects. Previously, we discussed scientific notation and significant figures. Aside from utilizing those methods to display data, precise and accurate numbers should also be used. Accuracy is a description of how close a measurement is to the true value of the quantity measured. Precision is the exactness of a measurement.
Three other mathematical names that should be applied to numbers in scientific investigation are mean, median and mode.
Mean (also known as arithmetic average) is the average of a list of numbers. It is found by adding all the numbers in the list and dividing by the number of elements in the list.
Example: Find the mean of 5, 6, 9, and 8.
We add all the numbers, and divide by the number of elements in the list, which is 4. (5 + 6 + 9 + 8) ÷ 4 = 7
So the mean of these four numbers is 7.
Median is the middle number in a list of numbers found by ordering them from least to greatest. If there is an odd number of numbers, the middle number in this ordering is the median. If there is an even number of numbers, the median is the sum of the two middle numbers, divided by 2.
Example: The night school program has students of various ages: 16, 14, 22, 16, 18, 15, and 20. What is the median of these ages? First you must place them in numerical order from least to greatest. 14, 15, 16, 16, 18, 20, 22.
Then determine what the middle number is. If there is an even number of numbers, add the two middle numbers together and divide by 2. 16 is the median age of the students at the night school
Mode is the number that occurs most often in a list of numbers.
Example: All the biology classes have the following number of students registered: 35, 36, 36, 34 and 28. Find the mode for the biology classes.
The mode is the number used most often. For this set of numbers it is 36.
In the scientific community, SI units are utilized worldwide. SI units are used for consistency. The SI system is based on the metric system and it contains seven basic units.
| SI Units | ||
|---|---|---|
| Quantity | Unit | Abbreviation |
| Length | meter | m |
| mass | kilogram | kg |
| Time | second | s |
| Temperature | kelvin | K |
| Electric current | ampere | A |
| Amount of substance | mole | mol |
| Luminous Intensity | candela | cd |
The above chart contains base units. However, sometimes the base unit is not the right unit to be utilized. For example: to weigh a book, you would measure it in kilograms; however, to weigh a pencil kilograms would be too large of a number. Since science does use the metric system, it is important to be able to convert from one unit to another. Prefixes are used for very large or very small numbers. Common prefixes and their amounts are listed below.
| Prefixes | ||||||||
|---|---|---|---|---|---|---|---|---|
| mega | kilo | hecto | deca | BASE | deci | centi | milli | micro |
| M | K | H | Da | gram(g) | d | c | m | U |
| 1,000,000 | 1,000 | 100 | 10 | Liter(L) | 0.1 | 0.01 | 0.001 | 0.000001 |
| 106 | 103 | 102 | 10 | meter(m) | 10-1 | 10-2 | 10-3 | 10-6 |
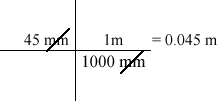
Since science uses the metric system, it is important to be able to convert from one unit to another. The common formula used for translating between measurements is the factor label method.
Example:
45 mm = _____ m
Convert the following measurements using the factor label method.
a) 9.50 g = _____ mg
b) 45.0 km = _____ m