The objective of this lesson is to learn some of the basics about the science of measuring and forecasting the weather.
Meteorology is the science of measuring and forecasting the weather. It is easy for us to take our modern meteorologists for granted and to be upset with them when their forecasts do not work out. However, in many ways meteorology is a young science that is maturing all the time as more data is collected and technology improves. Today, meteorological forecasting is a multimillion-dollar industry that affects the lives of everyone on the planet.
Perhaps the most important key to weather forecasting is data collection. The practice of setting up weather stations to collect information goes back several centuries. This data, collected over a long period of time, can be used to make models, look for trends, or to investigate different types of weather phenomena. The table below lists common meteorological instruments that you would find in a weather station and the type of data that they collect.
| Weather Instrument | Data Collected |
|---|---|
| Thermometer | Temperature |
| Barometer | Air Pressure |
| Anemometer | Wind Speed and Direction |
| Hygrometer | Humidity |
| Rain Gauge | Precipitation |
While traditional ground-based weather stations still play an important role in collecting data, meteorologists also take to the skies for their data. Weather balloons carry instruments to high altitudes to give a vertical picture of the atmosphere on a given day. This information is important because it gives the meteorologist information about the condition of the atmosphere at high altitudes that might affect low altitude air masses and our weather. Aircraft also play a role in gathering data from higher altitudes or from places that are not accessible any other way. For example, when forecasters are watching hurricanes, aircraft fly into the eye of the storm to conduct visual observations as well as to drop instruments to measure temperature, wind speeds, and pressure.
Going still higher, weather satellites in geostationary orbit keep a constant watch over the entire surface of the Earth. These satellites are equipped with cameras and instrumentation that can watch global cloud formations, air temperatures, and atmospheric moisture amounts over long periods of time. Perched high above the earth’s surface, these weather satellites can record long term climatic changes as well as keep a watchful eye on approaching hurricanes and dangerous thunderstorms.
Another important tool in weather monitoring and forecasting is Doppler radar. Computer advances have improved the data that can be derived from radar systems. In a typical Doppler radar operation, microwaves are beamed into an approaching storm. These microwaves are reflected back to the radar dish providing information such as wind speed, direction, and relative amounts of precipitation. Due to the many observations of weather spotters and the data they collect, analysis of Doppler radar imagery has improved greatly. Meteorologist can analyze these Doppler radar images in real time to locate where wind, rain, hail, and tornadoes are located within a complex thunderstorm. These tools have already saved many lives by providing advance warning to communities in the path of dangerous storms.
The business of weather forecasting is based upon analyzing trends. A number of climate and weather models have been developed over the years that assist the meteorologist in making a forecast. However, it is often up to the meteorologist to make professional judgments when the models give widely differing projections.
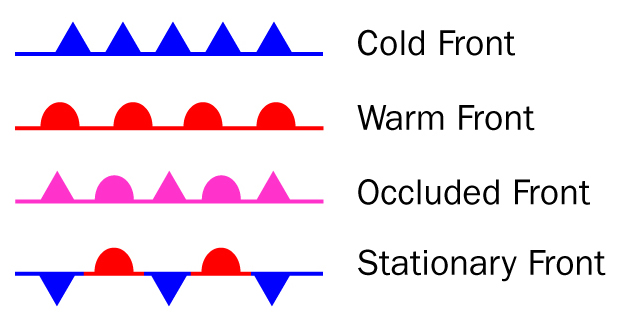
Weather maps play an important role in forecasting. These maps show the interactions and movements of warm and cool air masses over a wide area. The place where warm and cool air masses come together is called a front. These fronts are often where dramatic weather such as thunderstorms can happen. When a warm air mass is advancing and overtaking a cool air mass, the boundary is called a warm front. If a cool air mass is advancing and overtaking a warm air mass, the boundary region is referred to as a cold front. If the warm and cool air masses collide and neither air mass is overtaking the other, then the front is called a stationary front. If a cold air mass overtakes and replaces cool air mass at the surface with warm air above, the front is called an occluded front. A cold occlusion occurs when a cold air mass slides under a cool air mass at the surface. A warm occlusion happens with a cool air mass rides over the top of a cold air mass at the surface. The following symbols are used to plot the positions of fronts on weather maps.
A weather map with a completed set of isobars can reveal a number of standard weather patterns. A curved set of isobars that encircles an area of low pressure usually indicates a depression with the wind moving around its center in a counterclockwise direction (northern hemisphere). If a set of curved isobars is found to wrap around an area of high pressure it indicates the presence of an anticyclone. In the region of an anticyclone, the winds move in a clockwise direction (northern hemisphere). An open V-shape set of close isobars with low pressure inside will mark a trough while N-shaped close isobars with high pressure will indicate a high pressure ridge.