In this lesson, you will study how to compute the mean, mode, median, variance, and standard deviation of a distribution of data. We will also see how to determine the minimum, maximum, upper quartile, and lower quartile of the data set and use this information to display the data set in a box-and-whisker plot.
Statistics is a mathematical discipline concerned with collecting, organizing, and interpreting data. It is closely related to probability. When evaluating probability, we take information about an event’s possible outcome and calculate the likelihood of that outcome occurring. In statistics, we take a data set from a population and extrapolate information about that population. Using this information, we can make educated guesses about what will happen in the future or learn more about a certain aspect of the population that makes up our data set. Statistics plays an important role in many fields, including the social and biological sciences.
A data set, also called a data distribution, is a collection of numbers representing one property of a population. A given data set can be a quite large, presenting an overwhelming collection of numbers or properties. When analyzing a data set, we can focus on an important feature of the set to help simplify and summarize the information it contains. The most important of these features are listed below.
Data sets are usually enclosed in braces, or curly brackets { }. A data set can be made up of numbers or words, but the elements of a data set are usually numbers. The tools and terminology in this lesson apply to numerical data sets and every data set we will consider in this lesson will be a numerical one.
Examples of data sets
{98, 88, 75, 93, 92, 88, 68, 95, 100, 87, 90, 73}
{$1,250,000, $750,000, $900,000, $1,100,00, $1,500,000, $1,100,000, $2,300,000, $5,500,000}
{5, 34, 26, 26, 19, 21, 35, 57, 23, 34, 28, 29}
{$55, $75, $115, $35, $61, $80, $101, $54, $120}
{2.5, 0.9, 1.9, 12, 4.5, 25, 14, 45, 90, 5.25, 8.0, 102}
Let’s try an example. The data set {84, 92, 88, 91, 95, 92, 100, 96, 99} contains a student’s test grades in her history course. For this data set, find the:
The mean is the average of all the elements in the data set.
![]()
The mode is the value that appears most frequently. In this data set, the mode is 92.
The mode of a data set can be more than one number. The mode is defined as the number in a data set that occurs most often, a definition that seems like it can only apply to one number. However, consider the set {3, 15, 6, 23, 17, 15, 9, 11, 23, 2}. In this set, both 15 and 23 occur twice, while all of the other numbers occur only once. Because 15 and 23 recur an equal number of times, the mode of the set is 15 and 23.
If a data set has two, or three, or four numbers that occur most often, the mode is all of those numbers. If none of the numbers in the data set occur more than once, the set has no mode.
The median is the number that falls in the middle of the data set. More specifically, the median has an equal number of data set elements above it and below it. When determining the median, it helps to rewrite the data set with its elements in increasing order. In this case, the rewritten data set is {84, 88, 91, 92, 92, 95, 96, 99, 100}. Then determine which number lies in the middle of the data set. The median of this data set is 92.
When determining the median of a data set, always rearrange the set so that its elements are in increasing order. This is the best way to avoid careless error.
For a data set with an odd number of elements, the median has the same number of elements above and below it.
For a data set with an even number of elements, the median is the average of the two central elements.
For example, the median of the set {1, 4, 7, 19, 24, 28, 30, 42} is ![]() .
.
The range is the difference between a set’s absolute minimum (the smallest value in the set) and its absolute maximum (the largest value in the set). The range for the set {84, 92, 88, 91, 95, 92, 100, 96, 99} is 100 – 84 = 16.
The data set in our example is not very large; a quick glance over the set gives us a good idea of the student’s performance in her history class. However, when the data set is very large (containing hundreds, maybe thousands, of numbers), we cannot draw good conclusions by glancing over the data. However, the four features of a set mentioned above, mean, mode, range, and median, can help us form a general idea, or summary, of the information in a data set. These values will tell us the average value, the number that occurs most often, the number that the values of the data set are centered around, and the spread between the greatest value in the data set and the least value in the data set. This information can be a great help in analyzing or simplifying complicated data sets.
The mean, mode, range, and median are important values for a data set. However, a lot of information is lost when we reduce a large data set to these four numbers. Furthermore, these values are clearly not unique to a particular data set. Two very different data sets could have the same mean, mode, range, or median. To understand the elements of a data set better, we will introduce two more values associated with a data set.
Let our data set be represented by ![]() . The mean is symbolized by
. The mean is symbolized by ![]() and defined by the formula
and defined by the formula ![]() .
.
The variance ![]() is a positive number defined by
is a positive number defined by ![]() .
.
There is another, slightly different way to define variance. This other way is sometimes called the unbiased variance. The formula for unbiased variance is ![]() . Notice that, in this formula, we divide the summation by n-1 instead of n. Many textbooks use this form of variance and simply call it “variance.” Be aware of this, and pay close attention to which version you are dealing with any given case.
. Notice that, in this formula, we divide the summation by n-1 instead of n. Many textbooks use this form of variance and simply call it “variance.” Be aware of this, and pay close attention to which version you are dealing with any given case.
The variance formula tells us to average the square of the differences between all the values of the data set and the mean value. The resulting value is the variance and it measures how spread out or scattered the elements of the data set are. The larger the variance (![]() ) is, the more scattered the elements of the data set. The variance is zero only if each value equals the mean.
) is, the more scattered the elements of the data set. The variance is zero only if each value equals the mean.
The standard deviation ![]() is the square root of the variance. Because the variance is always a positive number, we do not have to worry about taking the square root of a negative number. Much like the variance, the standard deviation measures the dispersion of the elements of a data set. The larger the standard deviation is, the greater the spread among the elements of the data set. Standard deviation is defined by
is the square root of the variance. Because the variance is always a positive number, we do not have to worry about taking the square root of a negative number. Much like the variance, the standard deviation measures the dispersion of the elements of a data set. The larger the standard deviation is, the greater the spread among the elements of the data set. Standard deviation is defined by ![]() .
.
The correct choice is C. First, notice that each data set has the same mean value: ![]() . In this situation, the mean value does not give us very much information—it certainly does not distinguish the data sets from one another. However, their standard deviations are all different, as we will see below.
. In this situation, the mean value does not give us very much information—it certainly does not distinguish the data sets from one another. However, their standard deviations are all different, as we will see below.
Choice C makes sense because we can easily see that the elements of ![]() are more widely dispersed than those of any other data set.
are more widely dispersed than those of any other data set.
The important difference between variance and standard deviation arises with respect to units. Suppose we compiled a data set about the students in a class, consisting of each student’s height and using inches as our unit. To calculate the mean, we sum the heights and divide by the number of students; the unit is the same for the elements of the data set and the mean value, it does not change.
To compute variance, we introduce a square. This means the unit for the variance is ![]() . By taking the square root to get the standard deviation, we return the units to inches. The standard deviation thus gives us a measure of a data set’s dispersion, one which has the same units as the elements of the data set. Variance is the only value discussed here that takes an exponent—mean, mode, range, median, and standard deviation are all measured in units that are not squared.
. By taking the square root to get the standard deviation, we return the units to inches. The standard deviation thus gives us a measure of a data set’s dispersion, one which has the same units as the elements of the data set. Variance is the only value discussed here that takes an exponent—mean, mode, range, median, and standard deviation are all measured in units that are not squared.
Let ![]() be our data set.
be our data set.
![]()
![]()
![]()
Another way to simplify the information in a data set is to display the information in a graph. The box-and-whisker plot is one commonly used graph. Before we can draw a box-and-whisker plot, however, we must introduce some new terms.
These values provide a useful way to segregate the elements of a data set.
For example, given the data set below:
![]()
find the:
(a) median,
(b) minimum and maximum,
(c) lower quartile, and
(d) upper quartile.
The upper and lower quartiles are just the medians of the upper and lower halves of the data set. Just as we did when finding the median, we can simplify things by arranging the elements of the data set in increasing order.
![]()
For part (a), the median of this data set is ![]() .
.
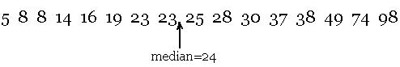
For part (b), the minimum is 5 and the maximum is 98.
To determine the lower quartile, we must find the median of the lower half of the data set, between the median and the minimum.
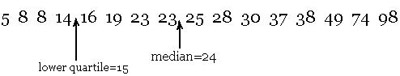
For part (c), the lower quartile is ![]() .
.
To determine the upper quartile, we must find the median of the upper half of the data set, between the median and the maximum.
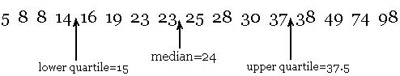
For part (d), the upper quartile is ![]() .
.
Quartiles partition the data set into four equal parts, each of which contains 25% of the data in the set. In the example above, the data set consists of 16 elements and each of the four quartiles contains 4 of the numbers from the original data set. The location of the quartiles quickly gives us an idea of the data set’s distribution.
A box-and-whisker plot graphically represents the median, upper quartile, lower quartile, and maximum and minimum on a line graph.
We will now draw the box-and-whisker plot associated with the data set from the example above,
![]() .
.
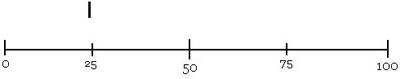
To make a box-and-whisker plot, begin by drawing a number line large enough to hold the entire data set. Mark the median value of the data set. For this data set, the median is 24.
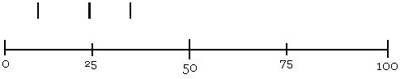
Next, make a mark above the lower and upper quartiles. For this set, the lower quartile is 15 and the upper quartile is 37.5.
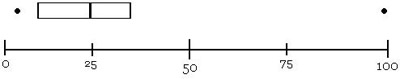
Next, make a box around the upper and lower quartiles and draw dots above the extreme minimum and extreme maximum.
Finish by adding a line connecting the extreme values. These “whiskers” added to the box around the quartiles give this data display its name.
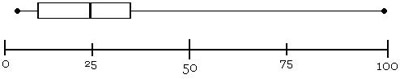
The box-and-whisker plot gives us an idea of the way that a data set’s elements are distributed. With a just a quick glance at the plot, we can gather a lot of useful information.
The location of the box on the whiskers tells us where the majority of the data set’s elements lie. In our example, the box sits far on the left half of the whiskers. We should therefore expect most of the elements to be less than the upper quartile value.
Within the box, the location of the median value tells us how evenly distributed the elements are around the median. In this example, the median value is almost exactly in the middle of the box, so we would expect that the elements are equally spread out around the median. In this case, there should be about as many elements between the lower quartile and the median as there are between the median and the upper quartile.
The real value of the box-and-whisker plot is that information such as that we just deduced about the data distribution holds no matter what the size of the data set is. Suppose we had a data set that consisted of 10,000 numbers, a set which had a similar box-and-whisker plot to the one described above. These two statements about the data distribution would still be true for this much larger data set, and we can tell that this is so because they have similar box-and-whisker plots.
Which box-and-whisker plot below correctly displays the following data set?
{2, 5, 16, 12, 10, 18, 14, 12, 15, 3, 4, 7, 6, 11}
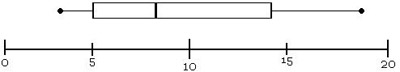
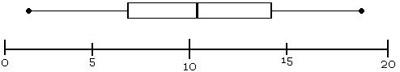
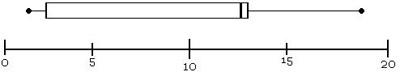
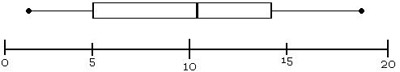
The correct choice is D. To create a box-and-whisker plot, we must first calculate the median. First, rearrange the data set so that the elements are in increasing order.
{2, 3, 4, 5, 6, 7, 10, 11, 12, 12, 14, 15, 16,
18}
This data set has an even number of elements, so the median is the average of the two central elements: ![]() . To calculate the lower quartile, compute the median of the set {2, 3, 4, 5, 6, 7, 10}. The lower quartile is 5. To determine the upper quartile, find the median of the set {11, 12, 12, 14, 15, 16, 18}. The upper quartile is 14. Finally, the minimum of the data set is 2 and the maximum of the data set is 18. The only choice that properly reflects this information is D.
. To calculate the lower quartile, compute the median of the set {2, 3, 4, 5, 6, 7, 10}. The lower quartile is 5. To determine the upper quartile, find the median of the set {11, 12, 12, 14, 15, 16, 18}. The upper quartile is 14. Finally, the minimum of the data set is 2 and the maximum of the data set is 18. The only choice that properly reflects this information is D.