In this lesson, we will study how to graph a linear equation, a linear inequality, or a system of inequalities.
One method for graphing a linear equation is to solve for several ordered pairs, plot the resulting points, and then connect the points.
Another method is to find the two intercepts, x and y. An intercept is the point where a line crosses the respective axis.
For example, to graph the equation ![]() , first find the x-intercept. Since this is the point where the line crosses the x-axis, y will equal 0. In the equation, set y equal to 0 and solve for x.
, first find the x-intercept. Since this is the point where the line crosses the x-axis, y will equal 0. In the equation, set y equal to 0 and solve for x.

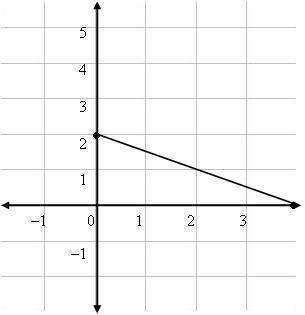
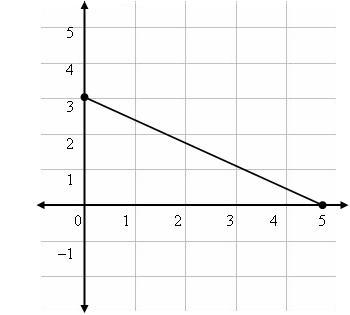
The x-intercept is the ordered pair (4, 0).
Because the y-intercept is the point where the line crosses the y-axis, set x equal to zero and solve for y.

The y-intercept is the point represented by the ordered pair (0, 2). Plot the points and connect them to find the line.
To find out if any other points are on the line, substitute the values for x and y into the equation of the line and see whether the equation is true.
Recall that:
![]()
A linear equation can also be written in the form y = mx + b, where m and b are constants. This is called slope-intercept form. The symbol m stands for the slope of the line, and b is the y-intercept.
To put the previous equation into slope-intercept form, solve for y.
Because the slope of the line is negative, the line slopes upward and to the left, indicating an inverse relationship between the two variables. The slope is ![]() , meaning that every time y increases by 1, x decreases by 2.
, meaning that every time y increases by 1, x decreases by 2.
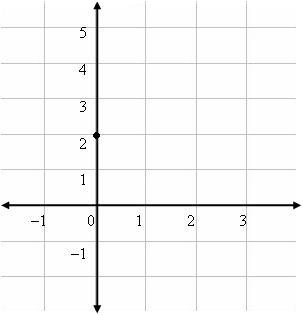
To graph, first plot the y intercept, which is at the point (0, 2).
For another example, graph the equation ![]() using the two intercepts.
using the two intercepts.
To do so, first find the x-intercept by setting y equal to 0.

Then find the y-intercept by setting x equal to 0.

Finally, graph the two points and connect them.
For extra practice, graph the equation ![]() using the slope-intercept form.
using the slope-intercept form.
First, solve for y.
The y-intercept is at the point (0, –3). Plot this point on the graph. The slope is ![]() , so from the y-intercept move 4 units right and 3 units up. Then connect the two points.
, so from the y-intercept move 4 units right and 3 units up. Then connect the two points.
If the coefficient of x is zero, we have an equation such as y = 5. This means that for all values of x, y = 5. Therefore, the graph is a horizontal line at y = 5 . If the coefficient of y is zero, then you have a vertical line at the given value for x.
An inequality divides the Cartesian plane into two half-planes. Begin by graphing the inequality as if it were an equation. If the inequality contains a ≤ or ≥ symbol, the line will be graphed as a solid line. If the inequality contains a < or > symbol, the line will be graphed as a dashed line. After graphing the line, shade in the half- plane that contains the values that solve the inequality. To find these values, pick a point on one side of the line (use the origin if possible). If the point makes the inequality true, shade the side of the line containing the point. If the point makes the inequality false, shade the opposite side of the line, i.e., the side that does not include that point.
For example, graph the inequality ![]() .
.
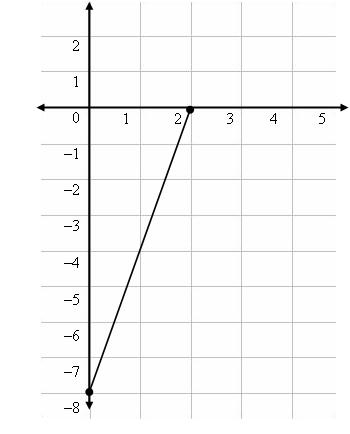
First, graph the inequality as the equation ![]() . To do so, find the x-intercept by setting y equal to 0.
. To do so, find the x-intercept by setting y equal to 0.

The x-intercept is (2, 0).
Then find the y-intercept by setting x equal to 0.

The y-intercept is (0, –8).
Graph the two points and connect them with a line. Use a solid line because the inequality contains the ≥ symbol.
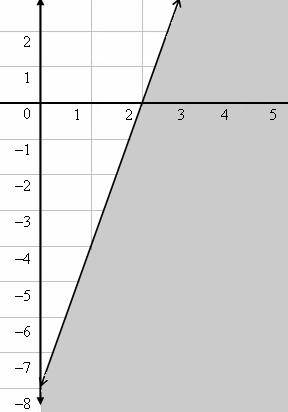
Finally, test to see which half-plane contains the values that solve the inequality. Choose a point to one side of the line and test the values. Use the point (4, 0).
![]()
The point (4, 0) lies to the right of the line and solves the inequality, so we shade in the half-plane to the right of the line.
For extra practice, graph the inequality ![]() .
.
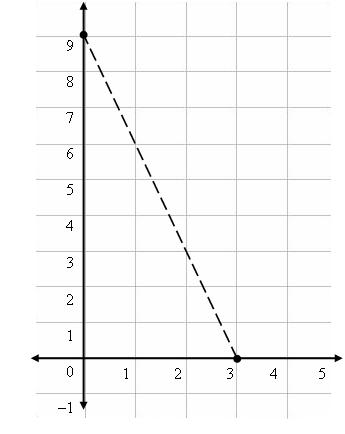
Begin by graphing the inequality as an equation. Graph the line by finding the intercepts.

The two intercepts are (3, 0) and (0, 9). Graph the points and connect with a dashed line. The line is dashed because the inequality contains the < symbol.
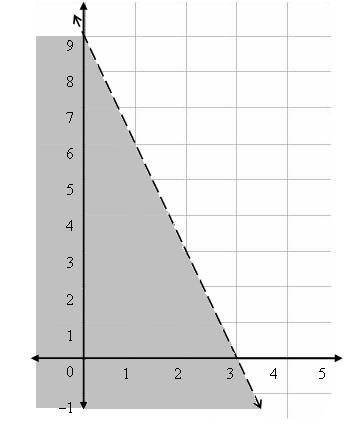
Then test a point to see what half-plane to shade. Try the point (0,0)
![]()
Because (0, 0) makes the equation true, shade in the half-plane to the left of the line.
We can solve a system of two or more inequalities by following the steps above, but repeated for each inequality.
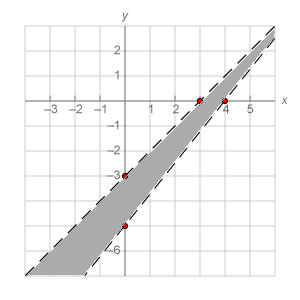
For example, graph the values that solve both x – y > 3 and 5x – 4y < 20.
To do so, first find the x- and y- intercepts for each inequality, and graph them as equations.
The intercepts of the first inequality are (3, 0) and (0, –3).
The intercepts of the second equation are (4, 0) and (0, –5).
Graph both lines as dashed, since both contain the < symbol.
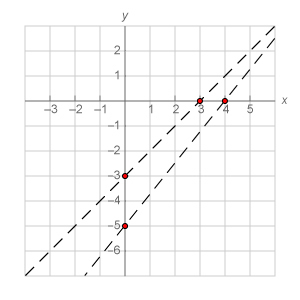
Because the original question asked us to shade in the areas that solve both equations, we can deduce that any values that solve both inequalities would lie between our two broken lines. Test the conjecture by choosing a point between the two lines and seeing if it solves both inequalities. In this case, choose point (2, -2) and plug it into both lines.

The point solves the first inequality.
The point also solves the second inequality. Therefore, shade in the area between the two broken lines.