In this lesson, you will learn the definitions of amplitude, frequency, period, and phase shift. You will also learn how to locate amplitude, frequency, period, and phase shift on a graph.
The common form when graphing amplitude, frequency, period, and phase shift is
f(t) = A sin (Bt + C) or f(t) = A cos (Bt + C), where A is the amplitude, ![]() is the frequency,
is the frequency, ![]() is the period, and
is the period, and ![]() is the phase shift. You are probably wondering where these variable formulas came from and what the amplitude, frequency, period, and phase shift look like on a graph. We will look at these formulas in more detail in this module.
is the phase shift. You are probably wondering where these variable formulas came from and what the amplitude, frequency, period, and phase shift look like on a graph. We will look at these formulas in more detail in this module.
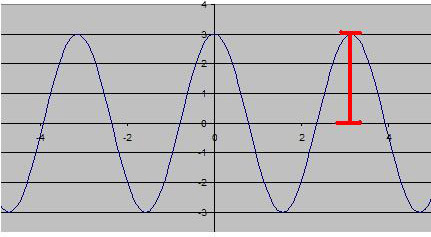
The amplitude is the height of each peak, or highest point, in a wave pattern measured from the middle of the wave. Equivalently, it is half the vertical height from lowest point, or trough to the peak.
We know that the amplitude is A in the formulas f(t) = A sin (Bt + C) and f(t) = A cos (Bt+ C), but how can we identify the amplitude on a graph?
Start with the function cos (Bt+C) in the equation, since cosine is simply a function and, by graphing, we can easily see what the function looks like. Below is a graph of the cosine function. You can see that the range in a cosine function is always from –1 to 1.
So you know that
![]() .
.
But we know that the amplitude is A, and A is not used here. So, what can you do to get A in the equation? Multiply both sides by A.
![]()
If A were negative, then
![]() .
.
So the range on the function ![]() is
is ![]() , where A is the amplitude. So using this information, you can see what the amplitude is on the graph of the function
, where A is the amplitude. So using this information, you can see what the amplitude is on the graph of the function ![]() . Using the formula
. Using the formula ![]() , you know that the amplitude is 3. But as you can see, the graph itself tells you the amplitude.
, you know that the amplitude is 3. But as you can see, the graph itself tells you the amplitude.
The same method can be applied to ![]() .
.
What is the amplitude on the graph below?
The correct choice is B. As you can see, the range is from [–2, 2], so the amplitude is 2.
The fact that the wave discussed here is “balanced” on the line x = 0, with a range that is symmetric about the point 0, is purely coincidental. A wave with a range of [4, 10] would have an amplitude of half the height from 4 to 10. Such a wave would have an amplitude of 3.
The frequency is the number of wave patterns within a distance from 0 to ![]() .
.
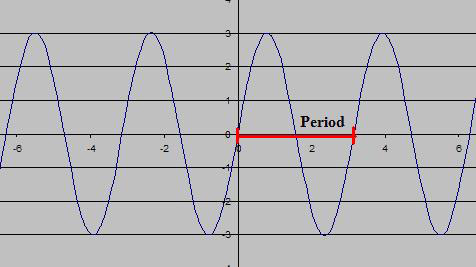
The period is equal to the horizontal distance on the x-axis between corresponding portions of the wave–from peak to peak, or trough to trough. In other words, the period shows the distance from where a wave pattern starts to where the wave pattern begins to repeat itself.
The period and frequency on a graph are always the reciprocal of each other. So, try and prove that the period is equal to ![]() .
.
Hint: We need to look at the period in terms of cycles and a complete cycle is from 0 to ![]() , or in degrees from 0° to 360°.
, or in degrees from 0° to 360°.
![]()
We know that we need to use the cycle information given above, and since we know that Bt + C can be written in terms of degrees, we know that
![]() .
.
Subtract C from both sides.
![]()
Divide both sides by B.
![]()
Add ![]() to the right side so that the manipulated equation will appear as
to the right side so that the manipulated equation will appear as ![]() . So the period is
. So the period is ![]() , and you can see that the variable C is not taken into account in the period.
, and you can see that the variable C is not taken into account in the period.
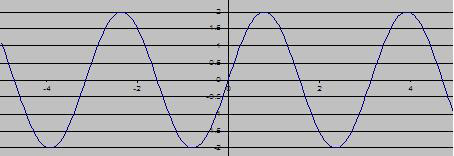
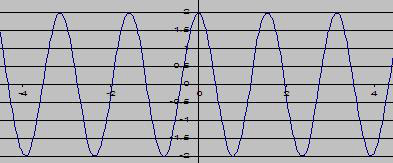
Using the graph below, you can see that the period is ![]() , and you can see that the frequency is 2, because the wave repeats twice between 0 and
, and you can see that the frequency is 2, because the wave repeats twice between 0 and ![]() .
.
What is the period on the graph below?
The correct choice is A. You can see a maximum point is at 0, and the next maximum point is between 1 and 2. The only answer choice between 1 and 2 is A.
Using the equation ![]() , what is the frequency?
, what is the frequency?
The correct choice is C. From the equation ![]() , we know that B is the frequency. Therefore, 2 is the frequency in the equation
, we know that B is the frequency. Therefore, 2 is the frequency in the equation ![]() .
.
A phase shift is a horizontal shift of a line to the left or right on a graph. The amplitude, period, and frequency do not change with the phase shift.
You may not have realized it, but you have already proved that the phase shift is equal to ![]() using the equations f(t) = A sin (Bt + C) and f(t) = A cos (Bt +C) in the proof of the period.
using the equations f(t) = A sin (Bt + C) and f(t) = A cos (Bt +C) in the proof of the period.
At the end of the proof, you showed that
![]()
This is equal to
![]()
This shows that there is a phase shift equal to ![]() . If
. If ![]() is negative, there is a shift to the left, and if
is negative, there is a shift to the left, and if![]() is positive, there is a shift to the right.
is positive, there is a shift to the right.
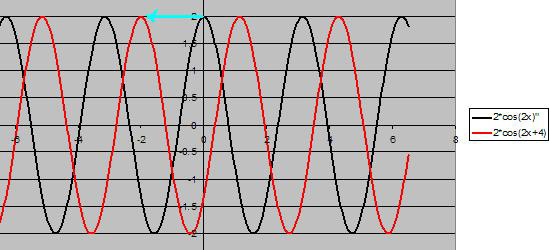
In the graph below, you can see the phase shift. The function in black is ![]() and the function in red is
and the function in red is ![]() .
.
Using the formula ![]() , you get
, you get ![]() . Since
. Since ![]() is negative, there is a shift to the left by 2. This shift is represented by the blue arrow.
is negative, there is a shift to the left by 2. This shift is represented by the blue arrow.
What is the phase shift of ![]() ?
?
The correct choice is D. Using the formula ![]() , we know that the phase shift equals
, we know that the phase shift equals ![]() . So using substitution, you get
. So using substitution, you get  .
.
Now that you know what the amplitude, frequency, period, and phase shift are, can you prove that ![]() can be written in the form
can be written in the form ![]() ? Try this proof yourself. You should be able to do this using what you have learned in this section.
? Try this proof yourself. You should be able to do this using what you have learned in this section.
An efficient way of doing this proof is by using an addition formula that we will go over in a future section. So if you are stuck, try and prove this using the formula ![]() .
.
![]()
Let ![]() and let
and let ![]() .
.
![]()
![]()
Using the addition formula given above, you get
![]()
So we know that ![]() .
.